SQL Diagnostic Report(23ai, 19.28)
- Get link
- X
- Other Apps
Before Oracle Database 23ai, the awrsqrpt.sql script was commonly used to analyze the evolution of a SQL statement’s execution plan, plan statistics, CPU usage, I/O, and elapsed time over a specified period. However, this approach had two main limitations:
- It required specifying two specific AWR snapshots.
- The information provided in its report was relatively limited.
Sample Output of awrsqrpt.sql:

With the introduction of Oracle Database 23ai, a new function, REPORT_SQL, was added to the DBMS_SQLDIAG package. This function generates a comprehensive HTML diagnostic report for a specified SQL statement, providing deeper performance insights. This functionality is also backported to Oracle Database 19.28.
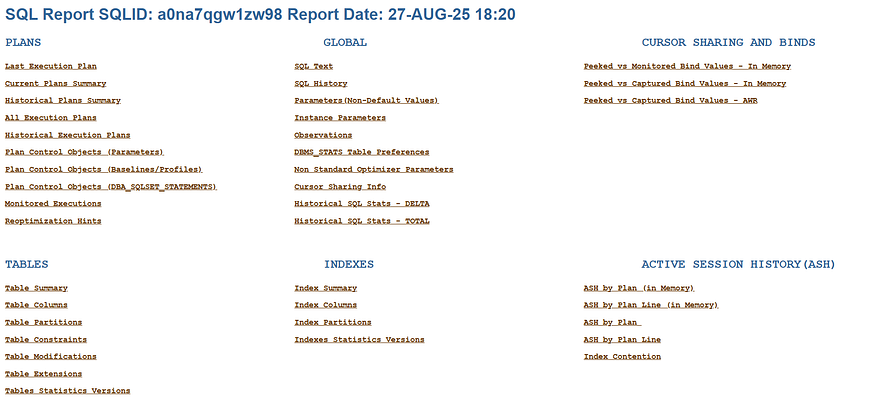
The REPORT_SQL function provides a graphical report in HTML format, allowing for the analysis of:
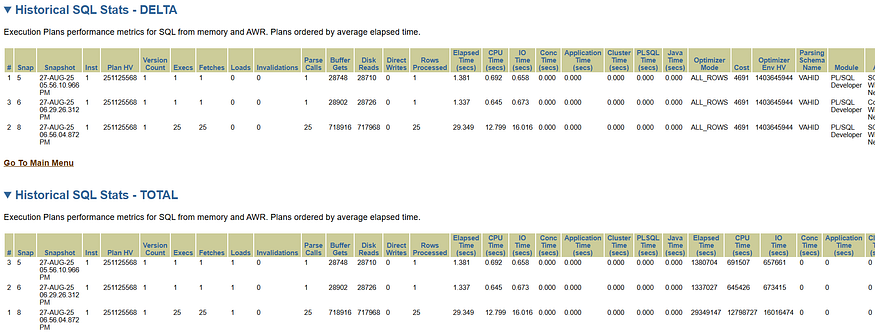
- Execution plan history
- Cursor sharing information
- Optimizer statistics history
- Index details
- And more
REPORT_SQL Function:
SQL> desc DBMS_SQLDIAG.report_sql
Parameter Type     Mode Default?
--------- -------- ---- --------
(RESULT)  CLOB
SQL_ID    VARCHAR2 IN
DIRECTORY VARCHAR2 IN   Y
LEVEL     VARCHAR2 IN   Y
Reports are generated in the specified DIRECTORY. For the LEVEL parameter, the following values are available:
· BASIC — A minimal report including only the essential details
· TYPICAL — The standard (default) report that includes both basic and advanced sections
· ALL — A comprehensive report covering all available details
Example: Generating a Report
- Create a Directory Object: First, create a directory object in the database that points to the location where the report will be stored.
SQL> create or replace directory DR_Diagnostic as '/oracle/Diagnostic';
Directory created.
2. Generate the Report: Use an anonymous PL/SQL block to invoke the REPORT_SQL function and generate the report.
SQL> DECLARE
  rpt1 CLOB;
BEGIN
  rpt1 := DBMS_SQLDIAG.report_sql(
               sql_id    => 'a0na7qgw1zw98',
               directory => 'DR_DIAGNOSTIC',
               level     => 'ALL');
END;
/
PL/SQL procedure successfully completed.
3.Access the Report: Go to the directory and unzip the file to view the HTML report:
[oracle@OL95 ~]$ cd /oracle/Diagnostic

[oracle@OL95 Diagnostic]$ ll
-rw-r--r--. 1 oracle asmadmin 22637 Aug 27 18:20 SQLR_a0na7qgw1zw98_202508271820.zip

 [oracle@OL95 Diagnostic]$ unzip SQLR_a0na7qgw1zw98_202508271820.zip
Archive:  SQLR_a0na7qgw1zw98_202508271820.zip
  inflating: SQLR_a0na7qgw1zw98_202508271820.html

[oracle@OL95 Diagnostic]$ ll
-rw-r--r--. 1 oracle oinstall 125063 Aug 27 18:20 SQLR_a0na7qgw1zw98_202508271820.html
-rw-r--r--. 1 oracle asmadmin  22637 Aug 27 18:20 SQLR_a0na7qgw1zw98_202508271820.zip
4. Review the Report:


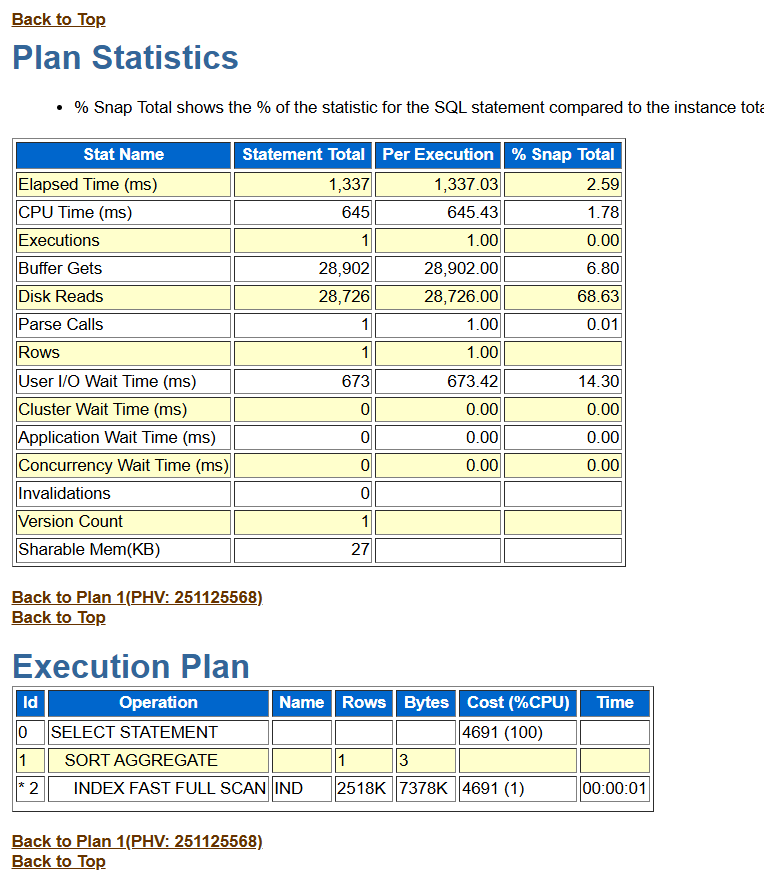
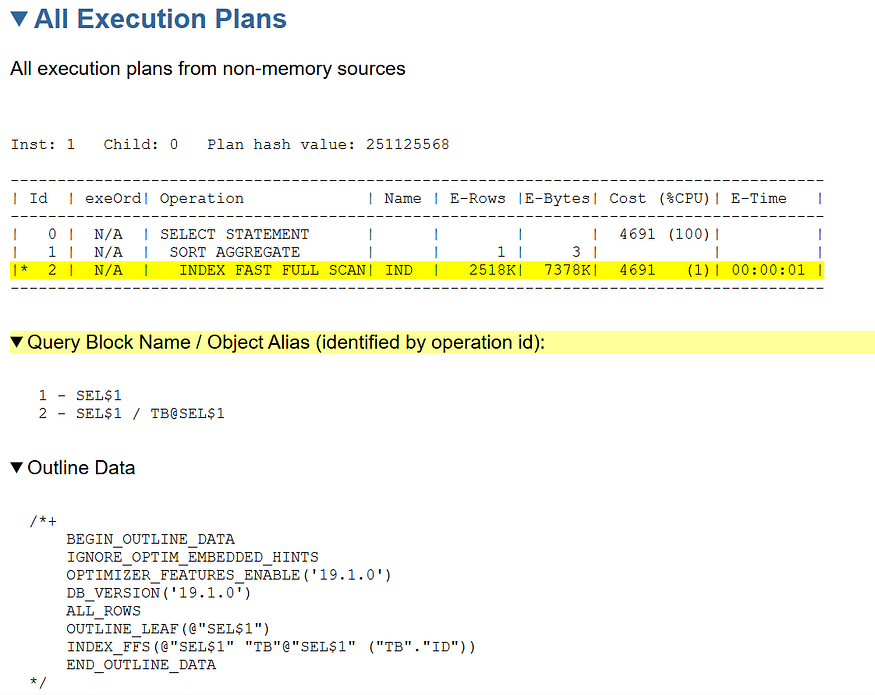
Execution Plan: Displays the execution plan history for the SQL statement.

ASH Data: Presents Active Session History data related to the SQL statement.

Written by Vahid Yousefzadeh
I have been a DBA since 2011 and I work with Oracle technology. Linkdin: linkedin.com/in/vahidusefzadeh telegram channel ID:@oracledb vahidusefzadeh@gmail.com
- Get link
- X
- Other Apps
Comments
Post a Comment